Colour Blinded by the Noise
Harriet Mason (Monash University), Rachel ES Rogers (University of Technology Sydney), Alison Kleffner (Creighton University), Di Cook (Monash University)

Jump to Discussion
Presentation
- Session
- I'm not so certain
- Time
- Thursday, Nov 12, 09:12 – 09:24 (US/Eastern) · session 08:00 – 09:30
- Room
- Hall Essex north
- Presenting from
- remote
Links
Sign in to access the Paper PDF.
- Preprint PDF(opens in new tab)
- Supplemental Material(opens in new tab)
Abstract
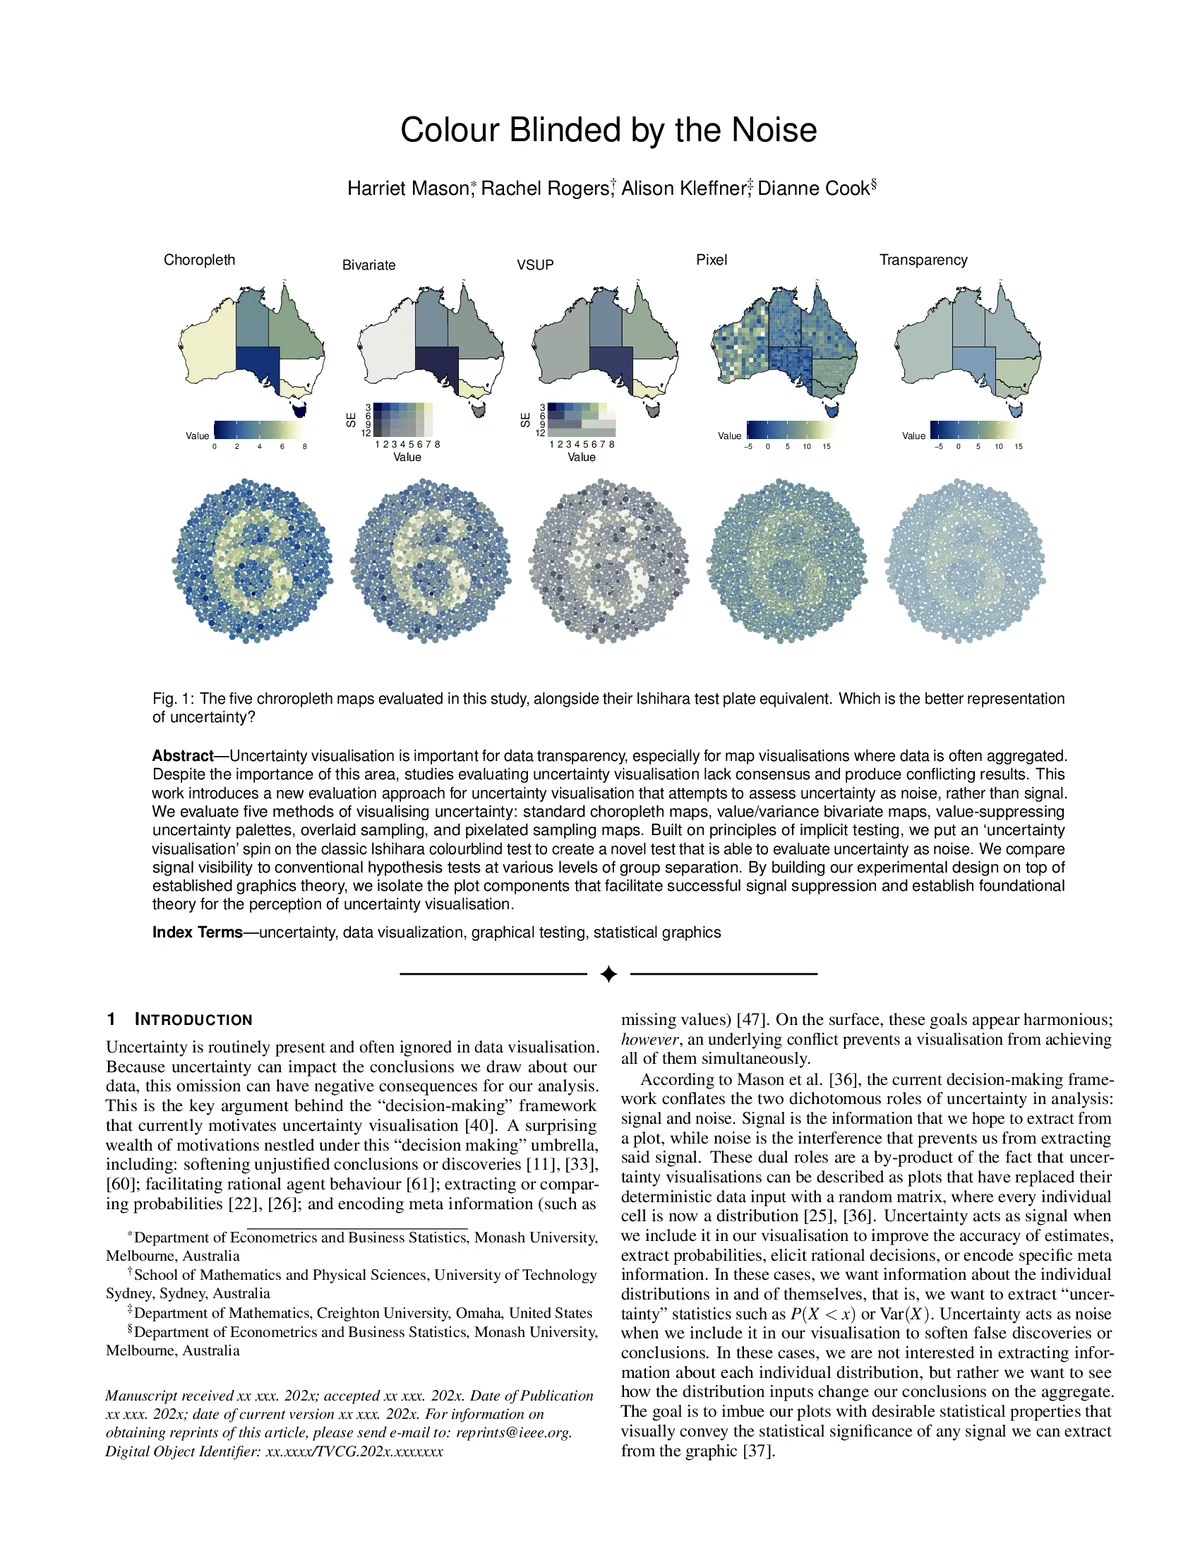
Uncertainty visualisation is important for data transparency, especially for map visualisations where data is often aggregated. Despite the importance of this area, studies evaluating uncertainty visualisation lack consensus and produce conflicting results. This work introduces a new evaluation approach for uncertainty visualisation that attempts to assess uncertainty as noise, rather than signal. We evaluate five methods of visualising uncertainty: standard choropleth maps, value/variance bivariate maps, value-suppressing uncertainty palettes, overlaid sampling, and pixelated sampling maps. Built on principles of implicit testing, we put an 'uncertainty visualisation' spin on the classic Ishihara colourblind test to create a novel test that is able to evaluate uncertainty as noise. We compare signal visibility to conventional hypothesis tests at various levels of group separation. By building our experimental design on top of established graphics theory, we isolate the plot components that facilitate successful signal suppression and establish foundational theory for the perception of uncertainty visualisation.
For Practitioners
This paper will be of interest to data scientists, statisticians, and researchers who use visualisations to explore and communicate uncertain data, particularly in fields such as environmental science, epidemiology, and geospatial analysis. Practitioners can apply the paper's findings when designing or selecting uncertainty visualisations, helping them assess whether a visualisation appropriately suppresses patterns arising from statistical noise while preserving meaningful signals.