UnitoPia: Interactive Construction of Pictorial Unit Visualization using a Contain-and-Fill Model
Jump to Discussion
Presentation
- Session
- Please don't just stare at the picture
- Time
- Tuesday, Nov 10, 10:36 – 10:48 (US/Eastern) · session 10:00 – 11:30
- Room
- Hall America center
- Presenting from
- Boston
Links
Sign in to access the Paper PDF.
- Supplemental Material(opens in new tab)
Abstract
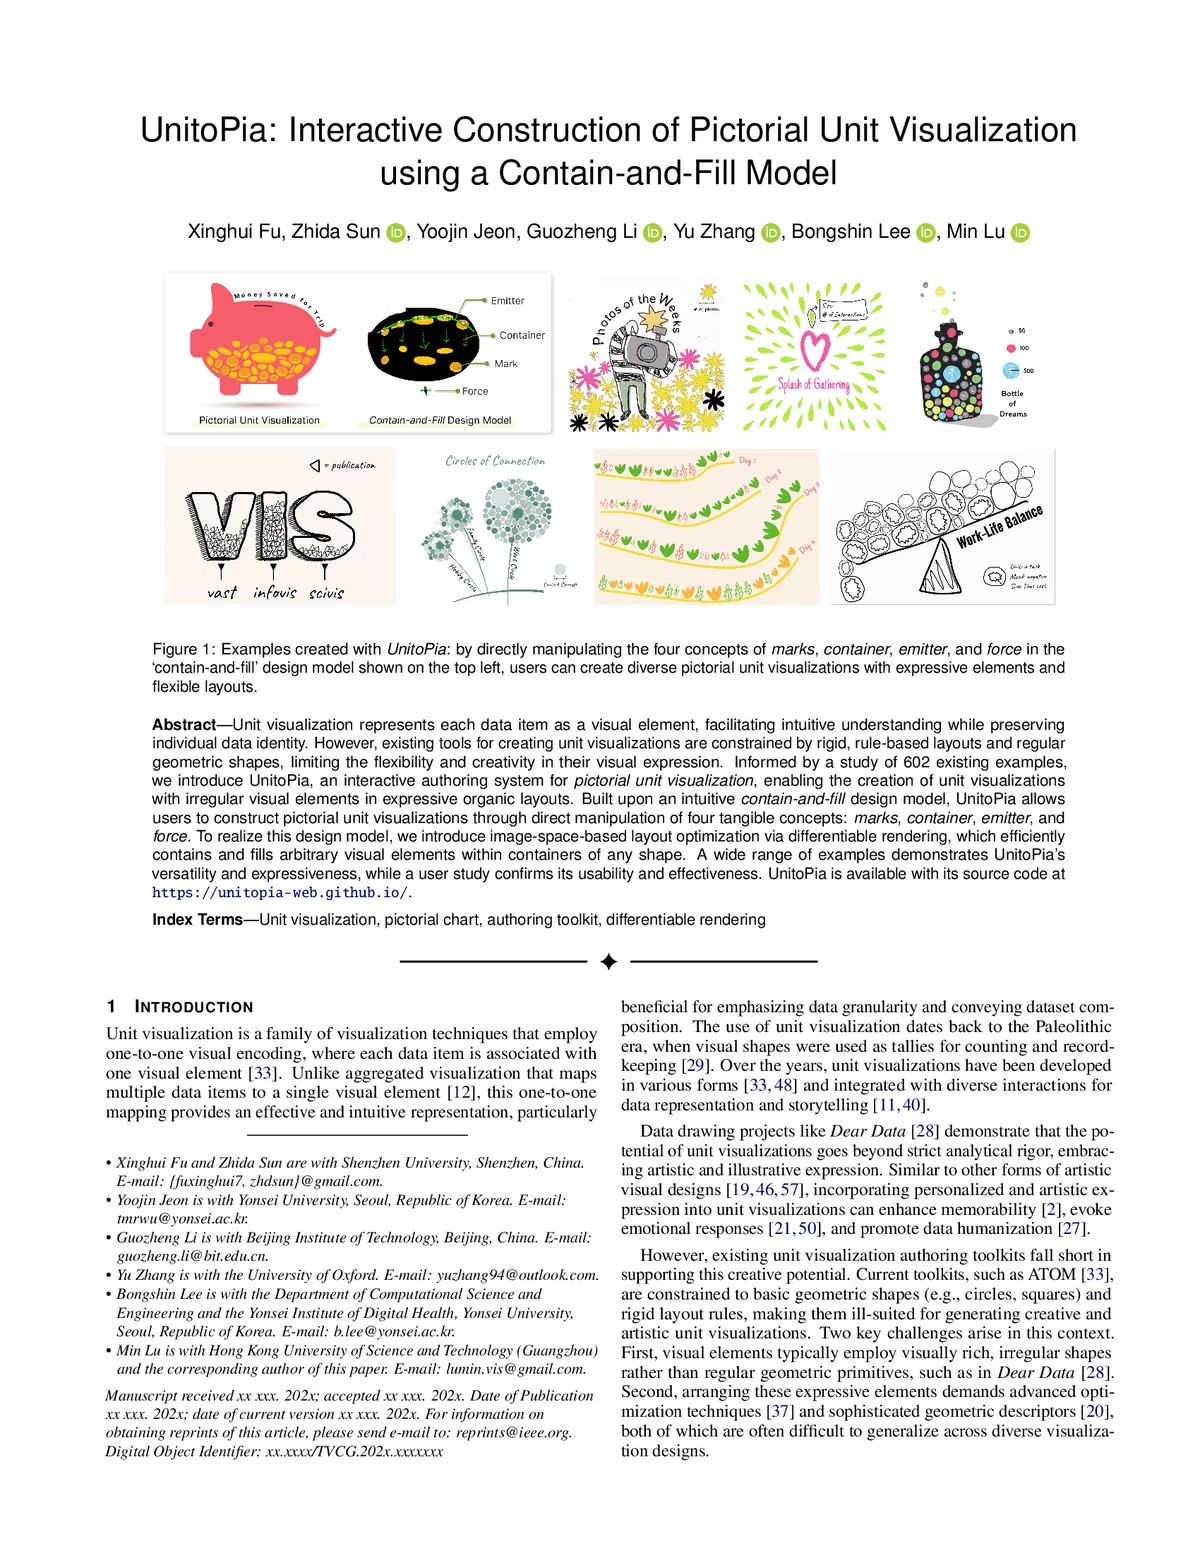
Unit visualization represents each data item as a visual element, facilitating intuitive understanding while preserving individual data identity. However, existing tools for creating unit visualizations are constrained by rigid, rule-based layouts and regular geometric shapes, limiting the flexibility and creativity in their visual expression. Informed by a study of 602 existing examples, we introduce UnitoPia, an interactive authoring system for pictorial unit visualization, enabling the creation of unit visualizations with irregular visual elements in expressive organic layouts. Built upon an intuitive contain-and-fill design model, UnitoPia allows users to construct pictorial unit visualizations through direct manipulation of four tangible concepts: marks, container, emitter, and force. To realize this design model, we introduce image-space-based layout optimization via differentiable rendering, which efficiently contains and fills arbitrary visual elements within containers of any shape. A wide range of examples demonstrates UnitoPia's versatility and expressiveness, while a user study confirms its usability and effectiveness. UnitoPia is available with its source code at https://unitopia-web.github.io/.
For Practitioners
Data journalists, data scientists, artists We introduce an interactive authoring tool for easy construction of pictorial unit visualizations.